Using Social Media Data to Help in a Flood
There are a lot of interesting case studies of groups using social media data to make what they do more efficient and effective. Here are a few interesting ones we have encountered:
- Researchers at Duke University Save Marine Wildlife using Social Media
- Using Social Media to Detect Adverse Drug Reactions
- Reporting of Crimes Anonymously in Mexico
- Using Social Media Data to Predict the Winners of Elections
Whether you are hoping to save the dolphins, predict the future or fight crimes, the different uses of social media data are endless. In today’s blog posting, we hope to explain how a recent project we completed helped save hours of time for an insurance agency processing claims after a natural disaster, all from data posted to Twitter.
Flooding in Toronto
On July 8, 2013, the Greater Toronto Area was hit with record breaking rainfall soaking the city throughout the day. The Toronto Pearson International Airport reported 126 mm (4.96”) of rainfall on Monday July 8. Power was knocked out for over 300,000 residents, thousands of basements had been flooded and millions of dollars in property had been damaged. A study released in August by the Insurance Bureau of Canada predicted over $850 million in property had been damaged as a cause of the flooding, making the natural disaster the most expensive in the Ontario providence’s history.
Not surprisingly, insurance companies in the Toronto area were swamped – flying in thousands of extra insurance adjustors to help with the massive amount of claims flowing in. BrightPlanet offered their harvesting services to a specific insurance company receiving an unprecedented number of claims in the area.
Using Twitter to Track the Most Affected Areas
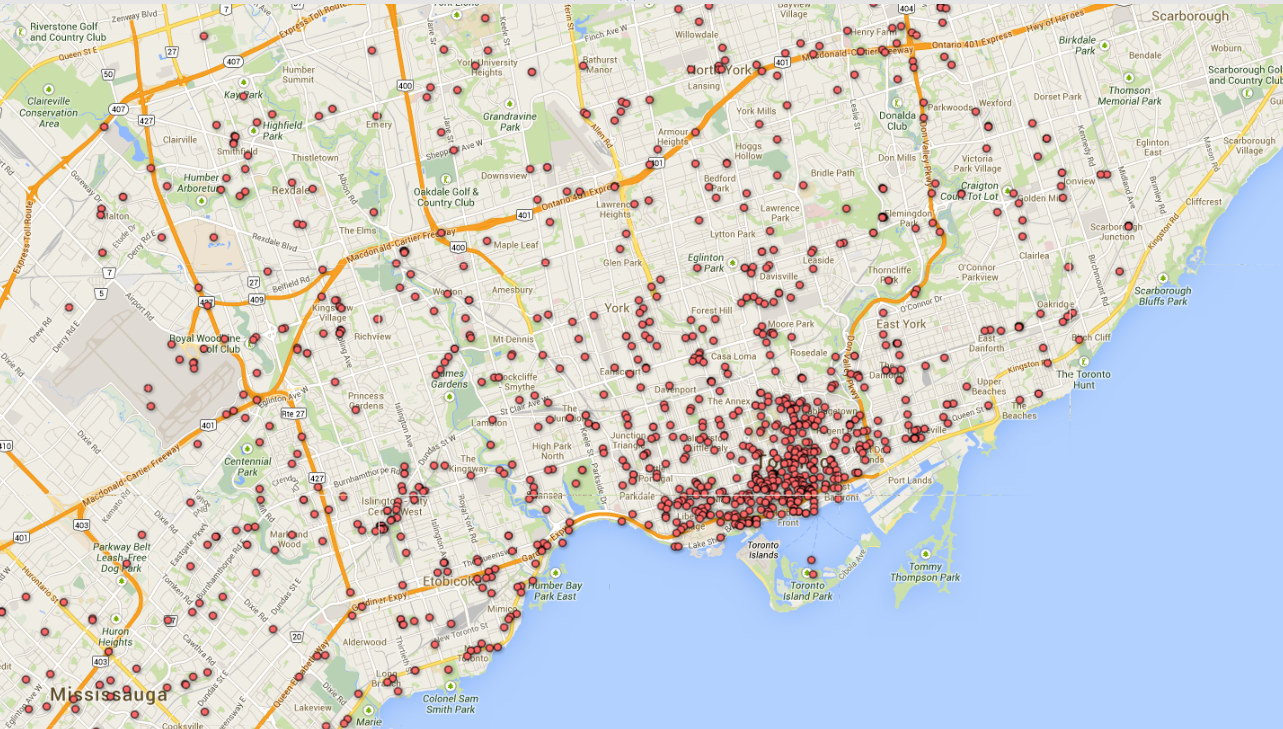
To assist with the vetting and triage of insurance claims, BrightPlanet harvested all tweets within the Greater Toronto Area. BrightPlanet then filtered and curated the tweets down to only tweets discussing specific effects of the flooding. Any tweets containing a latitude and longitude were then mapped in a heat map format in Toronto to show where the most chatter was happening about the flooding.
 This map gave the insurance company a real-time view of where the flooding was most likely occurring. As the insurance adjustors received new claims, the addresses of the claims were then overlaid on the map. Adjustors then knew outliers were ones to perhaps spend a little more time investigating to help ensure damage was indeed caused by the flooding and not some other previous incident (a broken sprinkler system, etc). A sample of some of the clustering of the tweets can be seen to the right. If you would like access to some of the raw data, contact [email protected].
We’re finding thousands of industries can take advantage of data not only on social media but also on the fastest growing repository of unstructured content, the Internet.
Want to learn more about other industries and their leveraging of Open Source Intelligence (OSINT)? Download this whitepaper to see how five industries are exploiting Big Data from the Deep Web.
//


