Data Visualization for Exploration: Second Sioux Falls Tableau User Group Meeting
Would you like to learn more about Tableau and data visualization? Want to better understand how to manage data and quit using Excel? Come join a group of local Tableau enthusiasts at our second Sioux Falls Tableau User Group (TUG) meeting.
Using Tableau for Data Exploration
During the free meeting, Chris Prendergast from ClickRain will be sharing how to use Tableau for data exploration. Most data visualization falls into one of three categories: visualization for reporting, visualization for storytelling, and visualization for exploration. Tableau is most often used for the first two, but is very powerful (and often underestimated) for the third.
It’s easy to tell a story when you have a story to tell, but what about when you have a dataset and no story? Tableau can help find the story within the data. Chris will share how to find hidden meaning within numbers.
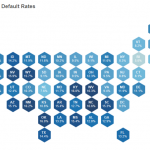
How to Map Anything
During the second half of the meeting, our own Jamie Martin will talk about using maps to help tell a story with data.
Maps are one of the most visually appealing features within data storytelling, but they continue to be underutilized. Gone are the days of maps being just a place for cities and roads and now are the days where maps can literally be anything. In this hands-on tutorial, Jamie will take you inside the different features and types of maps and will cover how to literally map anything.
You’ll learn how to create traditional style symbol and filled maps, and he’ll also walk through the basics of creating more advanced maps such as path, hex, and the growing, popular polygon maps. He’ll use real datasets and map real things. Feel free to bring your laptops and follow along in this hands-on tutorial.
Join Us!
We hope to see you there. Tableau is a prime tool for managing your business’ data, and we can’t wait to work together to get the most out of it!

//